Flutter Performance Optimisation: A Complete Guide With DevTools
Flutter performance optimisation with DevTools: identify and fix the four most common Flutter performance problems with before-and-after Dart code.

Flutter's reputation for high performance is well-earned but not automatic. The framework gives you the tools to build applications that run at 60fps and 120fps on modern hardware, but it also gives you enough rope to build applications that drop frames, leak memory, and stutter on animations if the widget tree is poorly structured.
- The Flutter frame budget is 16.6 ms at 60 Hz and 8.3 ms at 120 Hz. Anything beyond that and the user sees a dropped frame.
- The four most common Flutter performance problems are excessive rebuilds, unvirtualised lists, unoptimised images, and undisposed controllers.
constconstructors,ListView.builder,cached_network_imagewith size constraints, and matchedinitState/disposepairs fix the four problems structurally.- Always profile in
--profilemode on a physical device. Debug-mode performance numbers are meaningless. - Use Dart Isolates for CPU-intensive background work to keep the main UI thread inside its frame budget.
| Quick win | Why it matters |
|---|---|
| const constructors | Skips rebuilding unchanged widgets, the single biggest source of jank |
| List virtualisation (ListView.builder) | Renders only on-screen rows instead of all of them, keeping long lists at 60fps |
| Image caching (cached_network_image + memCacheWidth) | Stops re-downloading and re-decoding full-resolution images, cutting memory spikes and stutter |
| Controller disposal (match initState and dispose) | Prevents memory leaks that slow the app down the longer it runs |
Performance problems in Flutter are rarely mysterious. They follow predictable patterns, excessive widget rebuilds, unoptimised image loading, unvirtualised lists, unmanaged memory, and they are diagnosable with a specific, well-documented toolset. The difference between a Flutter application that feels native and one that feels sluggish is almost always a structural decision that can be identified, measured, and fixed.
This article covers the complete Flutter performance optimisation workflow, how to profile with DevTools, how to identify the four most common performance problems, and how to fix each one with concrete code examples. Reference points include the official Flutter performance documentation and the Flutter DevTools guide.
This article is part of our Complete Guide to Flutter App Development. Performance is directly connected to how you structure your widget tree, if you have not read our Flutter Clean Architecture guide, the structural decisions covered there have a direct impact on rebuild performance. Performance optimisation also connects to testing, our Flutter testing guide covers how to write performance regression tests that catch frame drops before they reach production.
Ready to build? Our Flutter development team is available for a free consultation.
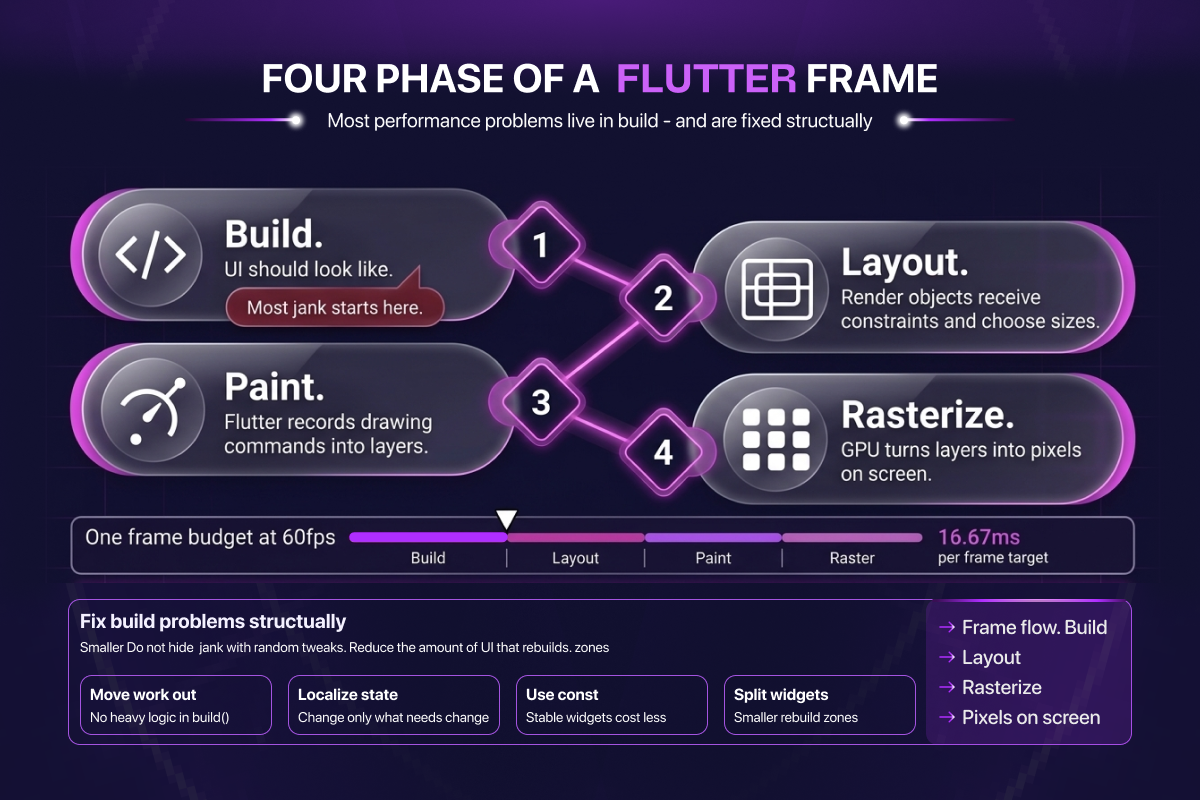
Diagram: the four phases of a Flutter frame. Most performance problems live in Build phase and are fixed structurally.
The Frame Budget, Understanding the Performance Target
Before profiling anything, the performance target needs to be clear. Flutter renders UI by producing a sequence of frames. Each frame has a time budget, the maximum amount of time allowed to prepare and render it before the display misses its refresh window and the user sees a dropped frame.
For a 60fps display, the frame budget is 16.67 milliseconds. For a 90fps display, the frame budget is 11.11 milliseconds. For a 120fps display, the frame budget is 8.33 milliseconds.
Any frame that takes longer than its budget is dropped. A single dropped frame in an animation produces a visible stutter. Consistent dropped frames produce what users describe as a "laggy" or "janky" application, and they notice it even when they cannot articulate why.
Flutter's frame pipeline has two threads that both contribute to frame time:
The UI thread runs the Dart code, building widgets, running layout, computing which elements changed. If your widget tree is large and rebuilds frequently, the UI thread is where you will see overruns.
The Raster thread takes the scene produced by the UI thread and rasterises it to pixels for the GPU. Shader compilation, complex compositing, and large images hit the raster thread. Impeller's pre-compiled shaders have eliminated a significant category of raster thread overruns, but complex compositing and unoptimised images can still cause problems.
Both threads have their own budget. A frame is only on time if both threads complete within the budget. DevTools shows both.
Using Flutter DevTools for Performance Profiling
Flutter DevTools is the official suite of performance and debugging tools for Flutter applications. It runs in a browser and connects to a running Flutter application in debug or profile mode.
Launching DevTools
# Run your app in profile mode, debug mode adds overhead that skews results
flutter run --profile

# In a separate terminal, open DevTools
flutter pub global activate devtools
flutter pub global run devtools
Profile mode compiles the application with AOT compilation, the same as a release build, but keeps the profiling hooks active. Always profile in profile mode, never in debug mode. Debug mode adds significant overhead that makes performance numbers meaningless.
The Performance Tab, Timeline View
The Timeline View is the primary tool for identifying frame drops. It shows a frame chart at the top, each bar represents one frame, coloured green if it met its budget and red if it exceeded it.
Clicking a red frame shows a detailed breakdown of where that frame's time was spent, which widget rebuilt, which layout computation ran, which paint operation took too long. This is where you identify the specific cause of a performance problem rather than guessing.
Reading the flame chart: The flame chart below the frame chart shows a call stack for the selected frame. Wider blocks took longer. Nested blocks are calls made by their parent. A wide block at the top of the UI thread flame chart that corresponds to a widget's build() method indicates that widget is rebuilding too frequently or too expensively.
The Widget Rebuild Stats
DevTools shows rebuild counts per widget in the Widget Rebuild Stats panel. A widget that rebuilds 60 times per second when its displayed content changes once per second has a rebuild problem.
Enable widget rebuild tracking:
// Add to main() during profiling sessions
import 'package:flutter/rendering.dart';

void main() {
  debugProfileBuildsEnabled = true;
  runApp(const MyApp());
}
The Memory Tab
The Memory tab shows heap allocation over time. A healthy Flutter application shows memory rising as screens load and dropping when screens are disposed. Memory that rises continuously during navigation, screens loading and never releasing their allocation, indicates a memory leak.
The Memory tab allows you to take heap snapshots and compare them. The diff between two snapshots shows exactly which objects were allocated and not released between the two points, identifying the specific class causing the leak.
The Four Most Common Flutter Performance Problems
Problem 1, Excessive Widget Rebuilds
This is the most common Flutter performance problem and the one most directly connected to how the application is structured.
Every time a Bloc emits a state or a Riverpod provider updates, the widgets listening to that state rebuild. If a widget is listening to a large state object but only displaying one field from it, it rebuilds on every change to that state object, including changes to fields it does not display.
The symptom: Widget Rebuild Stats shows high rebuild counts on widgets whose visible content rarely changes.
Fix 1, const constructors
A widget instantiated with const is canonicalised, Flutter reuses the existing instance rather than creating a new one when the parent rebuilds. Any widget with no runtime-variable properties should be declared const.
// Before, rebuilds every time parent rebuilds
child: Padding(
  padding: EdgeInsets.all(16),
  child: Text('Static label'),
)

// After, never rebuilds regardless of parent
child: const Padding(
  padding: EdgeInsets.all(16),
  child: Text('Static label'),
)
The Dart analyser flags missing const opportunities. Enable the prefer_const_constructors lint rule in analysis_options.yaml and fix every warning it produces, this is one of the highest-return optimisations available in Flutter.
Fix 2, BlocSelector for selective Bloc rebuilds
// Before, rebuilds on every AuthState change
BlocBuilder<AuthBloc, AuthState>(
  builder: (context, state) => Text(state.user?.displayName ?? ''),
)

// After, rebuilds only when displayName changes
BlocSelector<AuthBloc, AuthState, String?>(
  selector: (state) => state.user?.displayName,
  builder: (context, displayName) => Text(displayName ?? ''),
)
Fix 3, select() for selective Riverpod rebuilds
// Before, rebuilds when any part of userState changes
final user = ref.watch(userProvider);
Text(user.displayName)

// After, rebuilds only when displayName changes
final displayName = ref.watch(
  userProvider.select((user) => user.displayName)
);
Text(displayName)
Fix 4, Extract widgets instead of using helper methods
Building sub-trees as private methods (_buildHeader()) rather than as extracted widget classes means they rebuild as part of the parent.
// Before, _buildHeader() rebuilds with the parent every time
class ProfileScreen extends StatelessWidget {
  Widget _buildHeader() => const ProfileHeader();

  @override
  Widget build(BuildContext context) {
    return Column(children: [_buildHeader(), ...]);
  }
}

// After, ProfileHeader is a separate widget Flutter can skip
class ProfileScreen extends StatelessWidget {
  @override
  Widget build(BuildContext context) {
    return const Column(children: [ProfileHeader(), ...]);
  }
}
Problem 2, Unvirtualised Lists
Rendering a list of 500 items by building all 500 widgets at once is one of the most common and most impactful performance mistakes in Flutter. Every item is constructed, laid out, and painted, including the 480 items that are off screen and invisible to the user.
Fix, ListView.builder for all lists with more than a handful of items
// Before, builds all 500 widgets immediately
ListView(
  children: items.map((item) => ItemTile(item: item)).toList(),
)

// After, builds only visible items, recycles as user scrolls
ListView.builder(
  itemCount: items.length,
  itemBuilder: (context, index) => ItemTile(items[index]),
)
For lists with items of varying heights, use itemExtentBuilder or prototypeItem to help Flutter calculate scroll position without measuring every item:
ListView.builder(
  itemCount: items.length,
  itemExtent: 72.0, // Fixed height, Flutter skips measuring entirely
  itemBuilder: (context, index) => ItemTile(items[index]),
)
For grids, the same principle applies, GridView.builder over GridView with a children list. For extremely long lists with complex items, SliverList with a SliverChildBuilderDelegate inside a CustomScrollView provides the maximum level of control over the virtualisation window.
Problem 3, Unoptimised Image Loading
Images are the largest contributors to memory consumption and the most common cause of raster thread overruns in Flutter applications.
Fix 1, cached_network_image for all remote images
// Before, no caching, redownloads on every build
Image.network(imageUrl)

// After, cached, with placeholder and error handling
CachedNetworkImage(
  imageUrl: imageUrl,
  placeholder: (context, url) => const ImagePlaceholder(),
  errorWidget: (context, url, error) => const ImageError(),
  memCacheWidth: 400, // Decode at display size, not source size
  memCacheHeight: 400,
)
Fix 2, Decode images at display size. Flutter decodes images at their source resolution by default. A 2000x2000 pixel avatar image displayed at 48x48 pixels consumes 64 times more memory than necessary during decode. Use memCacheWidth and memCacheHeight on CachedNetworkImage or cacheWidth and cacheHeight on Image.network to decode at the display size.
Fix 3, WebP format server-side. WebP provides 25-35% smaller file sizes than JPEG and 25-35% smaller than PNG for equivalent visual quality, with support in all modern iOS and Android versions.
Fix 4, RepaintBoundary around image-heavy sections
RepaintBoundary(
  child: ImageGrid(images: images),
)
Problem 4, Memory Leaks from Undisposed Controllers
Every AnimationController, TextEditingController, ScrollController, StreamSubscription, and FocusNode allocates resources that persist until explicitly disposed.
Fix, always override dispose() in every State class that creates a controller
class _ProfileScreenState extends State<ProfileScreen>
    with SingleTickerProviderStateMixin {
  late final AnimationController _animationController;
  late final TextEditingController _nameController;
  late final ScrollController _scrollController;
  StreamSubscription<User?>? _authSubscription;

  @override
  void initState() {
    super.initState();
    _animationController = AnimationController(
      vsync: this,
      duration: const Duration(milliseconds: 300),
    );
    _nameController = TextEditingController();
    _scrollController = ScrollController();
    _authSubscription = authStream.listen(_onAuthChanged);
  }

  @override
  void dispose() {
    _animationController.dispose();
    _nameController.dispose();
    _scrollController.dispose();
    _authSubscription?.cancel();
    super.dispose();
  }
}
A useful practice during code review: for every initState() that creates a controller, verify the corresponding dispose() contains a matching disposal call.
For Riverpod users, the ref.onDispose() hook provides the equivalent guarantee for resources created inside providers:
@riverpod
Stream<User?> authState(AuthStateRef ref) {
  final controller = StreamController<User?>();
  ref.onDispose(() => controller.close());
  return controller.stream;
}
Performance Optimisation Checklist
Before shipping any Flutter feature to production, run through this checklist:
Widget rebuild optimisation:
- All static widgets use
constconstructors BlocSelectororselect()used wherever a widget only needs part of a state object- Sub-trees are extracted as widget classes, not helper methods
- No widget rebuilds detected in DevTools Widget Rebuild Stats that are not caused by genuine data changes
List performance:
- All lists with more than 10 items use
ListView.builder,GridView.builder, or equivalent - Fixed
itemExtentset where all list items have the same height - Complex list items wrapped in
RepaintBoundary
Image optimisation:
- All remote images loaded through
cached_network_image memCacheWidthandmemCacheHeightset to match display dimensions- Images served in WebP format from the CDN or storage service
Memory management:
- Every
initState()has a matchingdispose()with all controllers disposed - All
StreamSubscriptionscancelled indispose() - DevTools memory tab checked, no continuous heap growth during navigation
DevTools verification:
- Application profiled in
--profilemode on a physical device - No red frames visible in the Timeline View during key user interactions
- Frame time consistently under 16ms on the target device
Advanced, Isolates for CPU-Intensive Work
If your application performs heavy computation, parsing large JSON responses, processing images, running encryption, doing it on the main UI thread will cause frame drops. Dart isolates allow you to run code on a separate thread, completely isolated from the UI thread.
// Run expensive computation on a background isolate
import 'dart:isolate';

Future<List<Product>> parseProductsInBackground(String jsonString) async {
  return await Isolate.run(() {
    final decoded = jsonDecode(jsonString) as List;
    return decoded.map((e) => Product.fromJson(e)).toList();
  });
}
Flutter's compute() function is a simpler API for the common case of running a single function in a background isolate:
final products = await compute(parseProducts, jsonString);Use isolates for any operation that takes more than a few milliseconds of CPU time. JSON parsing of large API responses, image processing, file compression, and cryptographic operations are all good candidates.
Next Steps
Performance optimisation is not a one-time activity. It is a discipline built into the development process, profiling regularly in profile mode, reviewing rebuild counts on every pull request, and running the optimisation checklist before every release.
Continue with our Flutter Clean Architecture guide to understand how architectural decisions in the presentation layer directly determine how many widget rebuilds occur, our Bloc vs Riverpod guide for how state management choices affect rebuild performance, or our Flutter testing guide for how to write performance regression tests that catch frame drops before they reach production.
Frequently Asked Questions About Flutter Performance Optimisation
Why is my Flutter app slow even though I am not doing anything complex?
The most common causes are excessive widget rebuilds (missing const constructors, watching too-broad state objects with Bloc/Riverpod), unvirtualised lists (using ListView instead of ListView.builder), or unoptimised image decoding (loading full-resolution images at thumbnail sizes). All four problems are diagnosable in Flutter DevTools.
How do I profile a Flutter app for performance?
Run flutter run --profile on a physical device (debug mode adds overhead that skews numbers). Open Flutter DevTools in a browser and connect to the running app. The Timeline View shows frame drops; the Widget Rebuild Stats panel shows over-rebuilding widgets; the Memory tab shows heap allocation over time. Always profile on a real device, not an emulator, for accurate numbers.
What is the difference between debug, profile, and release mode in Flutter?
Debug mode runs with JIT compilation, hot reload, and extensive debugging hooks (adds significant overhead). Profile mode runs AOT-compiled code like release but keeps profiling hooks active (correct mode for performance testing). Release mode runs AOT-compiled code with no debugging hooks (the binary your users actually run). Never make performance decisions based on debug mode timings.
What is the difference between Flutter's UI thread and raster thread?
The UI thread runs Dart code, builds widgets, runs layout, and computes the render tree. The raster thread takes the prepared scene and converts it to pixels for the GPU. A frame is only on time if both threads finish within the frame budget (16.67ms for 60fps). UI thread overruns usually mean too much widget work; raster thread overruns usually mean image decoding or complex compositing.
How do I prevent memory leaks in Flutter?
Every controller (AnimationController, TextEditingController, ScrollController) and every StreamSubscription created in initState() must be disposed in dispose(). For Riverpod, use ref.onDispose(). Check the DevTools Memory tab during navigation, if heap size grows continuously without dropping when screens are popped, you have a leak.
Should I use ListView.builder even for short lists?
For lists with fewer than 10 items, ListView with a children list is fine, the rendering overhead of building all items at once is negligible. For lists with 10+ items, ListView.builder is strongly preferred. For lists with 100+ items, ListView.builder is mandatory, the difference in memory and startup time is significant.
What is Flutter's Impeller engine and does it make my app faster?
Impeller is Flutter's modern rendering engine that replaces Skia. Its main practical benefit is eliminating shader compilation jank, the brief stutter that happens the first time a complex animation plays. Impeller pre-compiles all shaders at build time so there is no first-frame stutter. For applications with complex animations, Impeller is a meaningful improvement; for simple UIs, the difference is less noticeable. See our guide to Flutter's rendering engine for the full picture.